JetBrains has released Rider 2024.1. This release contains a new monitoring tool window and a collection visualizer. There also appeared the plugins: .NET Aspire, AI Assistant and features regarding debugging.
JetBrains Rider provides an integrated monitoring tool that displays various aspects of an application, including CPU and memory usage, counters, environment variables, and more. By default, each time a project is run or debugged, JetBrains Rider shows the Monitoring tool window with real-time data. This window can be used to track application performance and analyze the state of the runtime environment at specific points in time.
The collection visualizer in Rider 2024.1 offers a graphical representation of collections (arrays, lists, dictionaries, and other enumerable types), enabling the expansion and collapse of elements, viewing of individual values, and easy navigation through the data structure. This feature aids in understanding the state of program data during debugging and in diagnosing issues with data collection, manipulation, or processing.
In a X thread, one user asked about supporting Unity Native Collections. Matt Ellis, a developer advocate at JetBrains, answered:
Unfortunately, the collections visualiser has been built and tested with the managed dotnet collections. We need to do some further work to ensure that they work correctly with Unity's native collections.
Moreover, AI Assistant has been released in the new version and is now available as a separate plugin. This change is driven by the need to provide more flexibility in decision-making around the use of AI-based technologies, offering more control over preferences and requirements in the working environment. AI Assistant still requires an active JetBrains AI subscription.
Furthermore, there is a .NET Aspire plugin - a new approach to solving the complex problems of building distributed applications on the .NET stack. This plugin can be downloaded directly from the JetBrains Marketplace or through Settings/Preferences | Plugins. More information about this plugin can be found in the dedicated blog post.
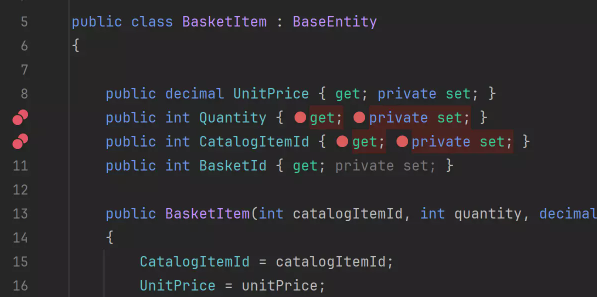
There also appeared a feature regarding .NET debugging. Starting with this update, Rider allows setting multiple breakpoints on a single line of code if multiple instructions are available. Breakpoints can be set using the corresponding built-in prompts or the keyboard shortcut (Ctrl + F8).
Inline breakpoints (Source: JetBrains blog)
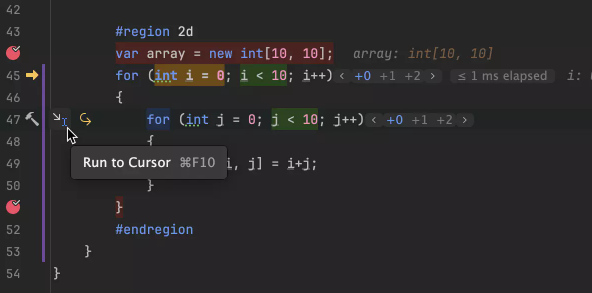
Another debugging feature in version 2024.1 is the adaptation of the Run to Cursor option to function similarly to its implementation in IntelliJ IDEA. This updated Run to Cursor feature enables a quick jump to a specific line of code while debugging. When the program is suspended, hovering the cursor over the desired line of code allows the use of the Run to Cursor pop-up to execute the code until it reaches that line.
Reworked Run to cursor inlay option (Source: JetBrains blog)
Other features can be checked on the official JetBrains website.