In a recent blog post, Google announced a new integration of the What-If tool, allowing data scientists to analyse models on their AI Platform – a code-based data science development environment. Customers can now use the What-If tool for their XGBoost and scikit-learn models deployed onto the AI Platform.
Last year the Google's Tensorflow team launched the What-If tool, an interactive visual interface designed to help data scientists visualize their datasets and provide them with a better understanding of the output of their TensorFlow models. Now it also offers support for XGBoost and scikit-learn models, and is no longer limited to just Tensorflow. Data scientists can use the new integrations from AI Platform Notebooks, Colab notebooks, or locally via Jupyter notebooks.
With the tool, data scientists can tweak various datapoints without writing any code, and analyse how the model would perform. Furthermore, they can test the performance of two different AI models simultaneously on the same dataset, allowing a higher degree of contrast and compare in which they can examine individual datapoints or entire dataset slices. In addition, they can:
- Contrast an AI model’s performance on a dataset against another model using ‘Facets Dive’ function and create custom visualization
- Inspect a single model's performance by organizing inference results into confusion matrices, scatterplots or histograms
- Edit a datapoint by adding or removing features to run robust tests on the AI model’s performance

Source: https://pair-code.github.io/what-if-tool/
Cassie Kozyrkov, head of decision intelligence, Google, stated in her towardsdatascience blog post:
While the What-If Tool is not designed for novices (you need to know your way around the basics and it’s best if this isn’t your first rodeo with Python or notebooks), it’s an awesome accelerant for the practicing analyst and ML engineer.
To use the new integration, a data scientist needs to train and then deploy a model on to Google Cloud AI Platform using the gcloud CLI. Next, the data scientist can view its performance on a dataset in the What-If Tool by setting up a WitConfigBuilder object.
config_builder = (WitConfigBuilder(test_examples)
  .set_ai_platform_model('your-gcp-project', 'gcp-model-name', 'model-version')
  .set_target_feature('thing-to-predict')
WitWidget(config_builder)
Any test samples are in the format expected by the model, whether that be a list of JSON dictionaries, JSON lists, or tf.example protos including ground truth labels - allowing exploration on how different features impact the model’s predictions.
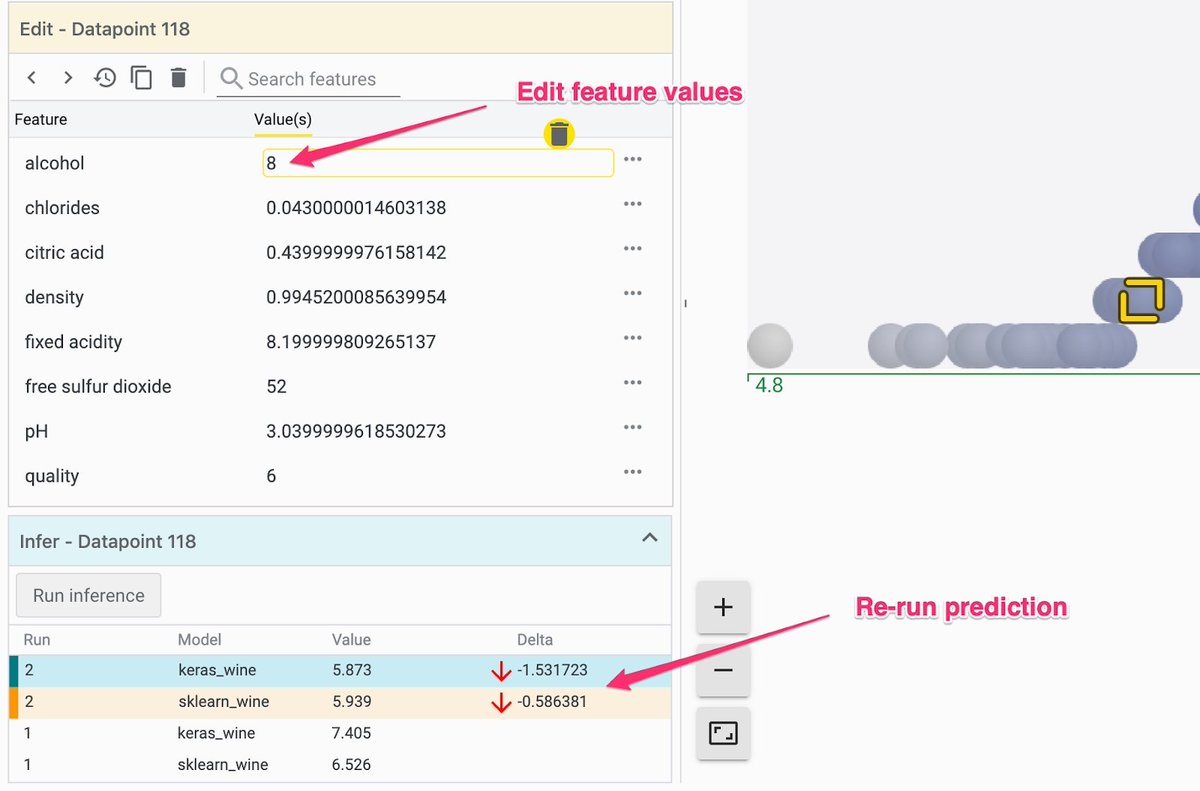
The first view a data scientist sees is Datapoint Editor, which shows all examples in the provided dataset and their results from prediction through the model. Moreover, from this editor in the main panel, a data scientist can change anything about the datapoint and rerun it through the model to see how the changes affect the prediction.
Source: https://twitter.com/7wData/status/1152606660743110656/photo/1
Through the next tab, Performance + Fairness, data scientists can view the aggregate model results over the entire dataset. Furthermore, from this tab, Sara Robinson, developer advocate, Google Cloud Platform, said in the blog:
You can slice your dataset by features and compare performance across those slices, identifying subsets of data on which your model performs best or worst, which can be very helpful for ML fairness investigations.
More details on the features of the What-If tool are available through the walk-through guide and documentation.
