AWS recently created a new template within the AWS Observability Accelerator project that provides an integrated telemetry solution for Elastic Kubernetes Service (EKS) workloads.
The AWS Observability Accelerator began as a series of infrastructure-as-code (Terraform) examples for customers to use as starting points for monitoring specific application types deployed on EKS. The project configures EKS workloads with AWS managed instances or distributions of tried and tested components of the modern observability stack: Prometheus, for scraping and storing time-series metrics; Grafana, for querying, visualisations and analysis; and OpenTelemetry, for generating, collecting and exporting telemetry data.
The newly released template provides a one-click solution that includes Prometheus and Grafana workspaces, OpenTelemetry collectors and IAM roles deployed in the architecture shown below:

Source: https://github.com/aws-observability/terraform-aws-observability-accelerator#readme
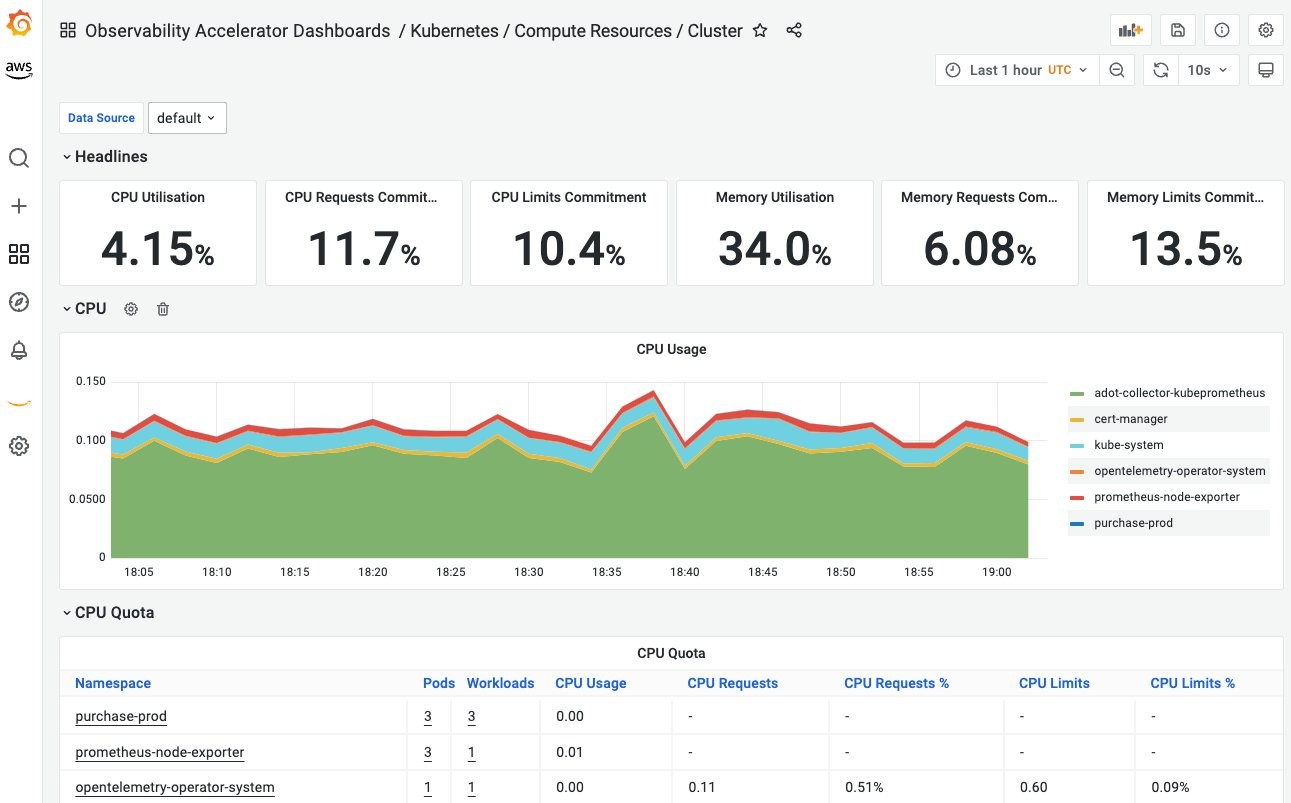
It also includes configured alerts and recording rules, resulting in a dashboard like this:
While preconfigured dashboards and alerts are a useful start for monitoring, observability of applications in environments as dynamic and complex as Kubernetes workloads require interrogatability. Jay Livens of Dynatrace writes in an exposition on observability:
In an observability scenario. . . you can flexibly explore what’s going on and quickly figure out the root cause of issues you may not have been able to anticipate.
The use of Grafana and its native integration with Prometheus for querying data gathered exposed via OpenTelemetry allows users of the AWS Observability accelerator to investigate unanticipated behaviours on their EKS workloads.
An often proposed alternative to components of the AWS Observability Accelerator would be Datadog. By deploying Datadog Agents in an EKS cluster and enabling its AWS integrations, it provides a unified platform for logs, traces and metrics which make up the three pillars of an observability solution.
According to a 2022 Gartner report on the Magic Quadrant of Application Performance Monitoring and Observability, DataDog sits as a leader in the field of Observability alongside Dynatrace. The Dynatrace offering also utilises a similar approach of an agent and integrations for routing the observability data to its Saas platform.
The AWS Observability Accelerator is maintained as an open-source project on GitHub by AWS Solutions Architects and the community.
